In a previous post, we discussed the process of analyzing qualitative data using a codebook and codes. A code is a word or phrase that helps define a piece of qualitative data as belonging to a category to help draw conclusions from the data [1]. This process can essentially be split into three stages. 1) A codebook is , through a process of raters looking at portions of the data and developing codes from common themes that keep appearing. 2) Each rater codes the same subset of data using codes from the codebook. 3) Interrater reliability (IRR) is on the raters’ codes.
In this post, I will focus on step 3, i.e., how IRR is calculated. IRR is the degree of agreement between raters [1]. This is important to know when doing qualitative coding because descriptive responses can be subjective. Researchers may be able to pull out very different meanings from the same response but having an IRR calculation tells researchers how well the raters agreed on a code. If IRR is calculated on a subset of the data that all researchers code, the researchers can then decide what to do next in their project. If the IRR for the subset is within an acceptable range, researchers can split the full dataset between raters for coding. This means that from that point on, no two raters will deal with the same responses, saving time without losing reliability. Another option is that all the raters can code all the data, in cases where multiple or interdisciplinary perspectives may be important to capture in the coding process.

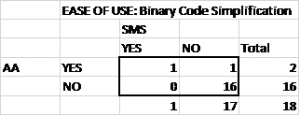
To calculate the IRR between two raters for one coding dimension, 2×2 tables are created that show how many times two raters agreed on a code and how many times they disagreed on a code. With this table, IRR for this code between two raters for a dimension can be calculated. Table 1 shows the table for the code “EASE OF USE” between two raters (AA and SMS). Data in the top left cell represents the number of times both raters agreed that a statement should be characterized by the code. Data in the bottom right cell represents the number of times both raters agreed that a statement should not be characterized by the code. Data in the remaining two cells represents the number of times when the two raters disagreed on whether the statements should be characterized by the code. This table is called a Binary Code Simplification table and is one option to use when raters can assign multiple codes for one response.
Next, the observed and expected agreements are calculated. The observed agreement is expressed as the number of times the two raters agreed, essentially the sum of the left diagonal on the table, over the total amount of responses coded [2]. The expected agreement is expressed with the following formula [2]:
(number of times raters disagreed) * ((number of times both raters used the code) + (number of times both raters did not use the code)) / ((number of responses)^2)
Using the observed and expected agreements, Cohen’s Kappa is then calculated. This value ranges from -1 to 1 with κ equal to zero indicating a completely random agreement [2]. A κ value of 1 indicates that there was perfect agreement between the two raters [2]. A κ value above 0.8 indicates an almost perfect agreement [2]. To calculate Cohen’s Kappa, we use the following formula [2]:
(observed agreement) – (expected agreement) / (1 – (expected agreement))
As stated previously, it is up to the researchers on what to do next after calculating IRR. Our team has decided that if κ is less than 0.7, then we will review the codebook for discrepancies and confer with each other to clarify the codes and ensure that conceptual misunderstandings of codes are minimized. Then we will choose a new subset of data to begin the process again. When κ is greater than or equal to 0.7, we will split the data between raters for coding, since we can be more confident that the raters have a reasonable agreement on the codes. This saves research time since all the raters do not have to code all the data. Once all the data has been coded, we can begin to draw conclusions from the qualitative data about common themes and support for our hypotheses on our project.
I am a third-year undergraduate student majoring in Computer Engineering. While I experience a lot of practice in program coding and hardware design in class, I have had very little experience in analyzing data. Through this experience, I have learned a lot about the world of research and data analysis, such as research coding and calculating IRR. By learning these subjects, hopefully I can calculate my own IRR and recognize if other research projects have taken the best route when handling their qualitative data.
REFERENCES
- Gwet, K. L. (2014). Handbook of inter-rater reliability: The definitive guide to measuring the extent of agreement among raters. Advanced Analytics, LLC.
- Hallgren, K. A. (2012). Computing inter-rater reliability for observational data: an overview and tutorial. Tutorials in quantitative methods for psychology, 8(1), 23.