In a previous post, I mentioned that we were working on selecting a representative set of motions from our Kinder-Gator dataset [1] to help us test recognition of whole-body motions. We have since designed a toolkit to visualize this representative set of motions while we explored different representations and how they affected recognition accuracy. We designed the toolkit in C# using Windows Presentation Foundation (WPF), which is a UI framework that uses the Extensible Application Markup Language (XAML) to create desktop client applications [2]. In this blog post, I describe the main components of the toolkit and challenges I faced in the design of the toolkit:
Designing the Interface: The Kinder-Gator dataset [1] includes examples of children and adults performing actions while forward facing the Kinect. Within this dataset, 11 of the actions comprise the representative set of actions, selected using the methods discussed in the previous post. Since the toolkit interface is the window that users can interact with, it is important that the interface includes controls that can enable users to select their preferences. These controls will depend on the information that the Kinder-Gator dataset format specifies, which are the population (child vs. adult) and the actions (i.e., representative set of actions). Consequently, I included the following controls to the interface (Figure 1 shows the full interface of our toolkit):
- A button that opens a file browser for users to upload the Kinder-Gator dataset (or other datasets with similar formats), and a text box that indicates whether the dataset was loaded successfully.
- Radio buttons for each level of the population in the Kinder-Gator dataset (i.e., child and adult) so that users can visualize actions from a specific population. Kinder-Gator includes the motions of both children and adults, and each file is represented in the format “POSE-PID-ACTIONNAME-TIMESTAMP.CSV”. Each participant in the dataset has a unique participant ID (PID). A file belongs to a child or an adult category if the PID belongs to a child or adult participant respectively (the mapping between population and PIDs are included in the Kinder-Gator dataset README file). Once a radio button (i.e., population) is selected, only files with PIDs corresponding to the selected population are considered for visualization.
- Checkboxes for actions in the Kinder-Gator dataset, through which users can select one or more actions to visualize. Checkboxes are added to the interface dynamically, based on the elements in a gesture array. The gesture array is composed of a hard-coded set of gesture names, representing the space of gestures that can be visualized. By default, the list of actions shown on the interface corresponds to the representative set of actions we chose from the Kinder-Gator dataset. That is, the gesture array is pre-populated with the names of all the actions in the representative set. The gesture array can be modified to ac commodate a different set of actions.
- Other controls in the interface include tab controls for the supported visualization methods: (averageFrame and Per Joint), which we will discuss next, and buttons to enable the visualization process (“Submit”) and clear user options (“Refresh”).
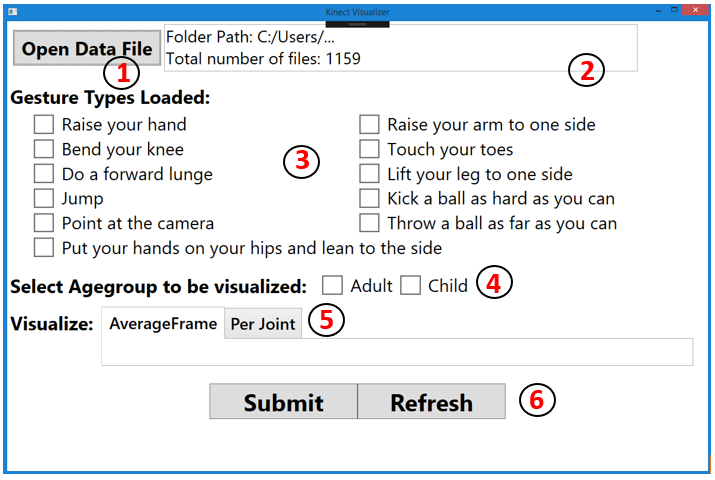
Figure 1: Toolkit Interface.
Visualizing Kinect Motions: The Microsoft Kinect tracks the movement of 20 joints in 3-dimensional space over time, so an action in the dataset includes the paths travelled by 20 joints in 3D space. Therefore, actions in the Kinder-Gator dataset [1] can be visualized by showing the motion paths of each joint over the duration of the motion (Per Joint method). To visualize the motion paths, I included checkboxes to represent each of the joints, which enables users to select one or more joints to be visualized for an action-category pair. Figure 2a shows the interface when the right wrist joint (“WristRight”) is selected for the action “Raise your hand” and the Age group “Adult”. Figure 2b shows the corresponding visualization (i.e., the motion paths of the “WristRight” joint across all “Adult” participants for the action “Raise your hand”).
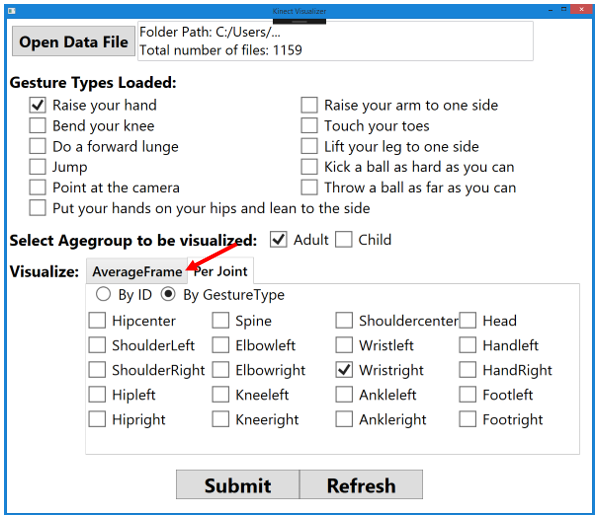
Figure 2a: Toolkit Interface after the Per Joint method has been selected.
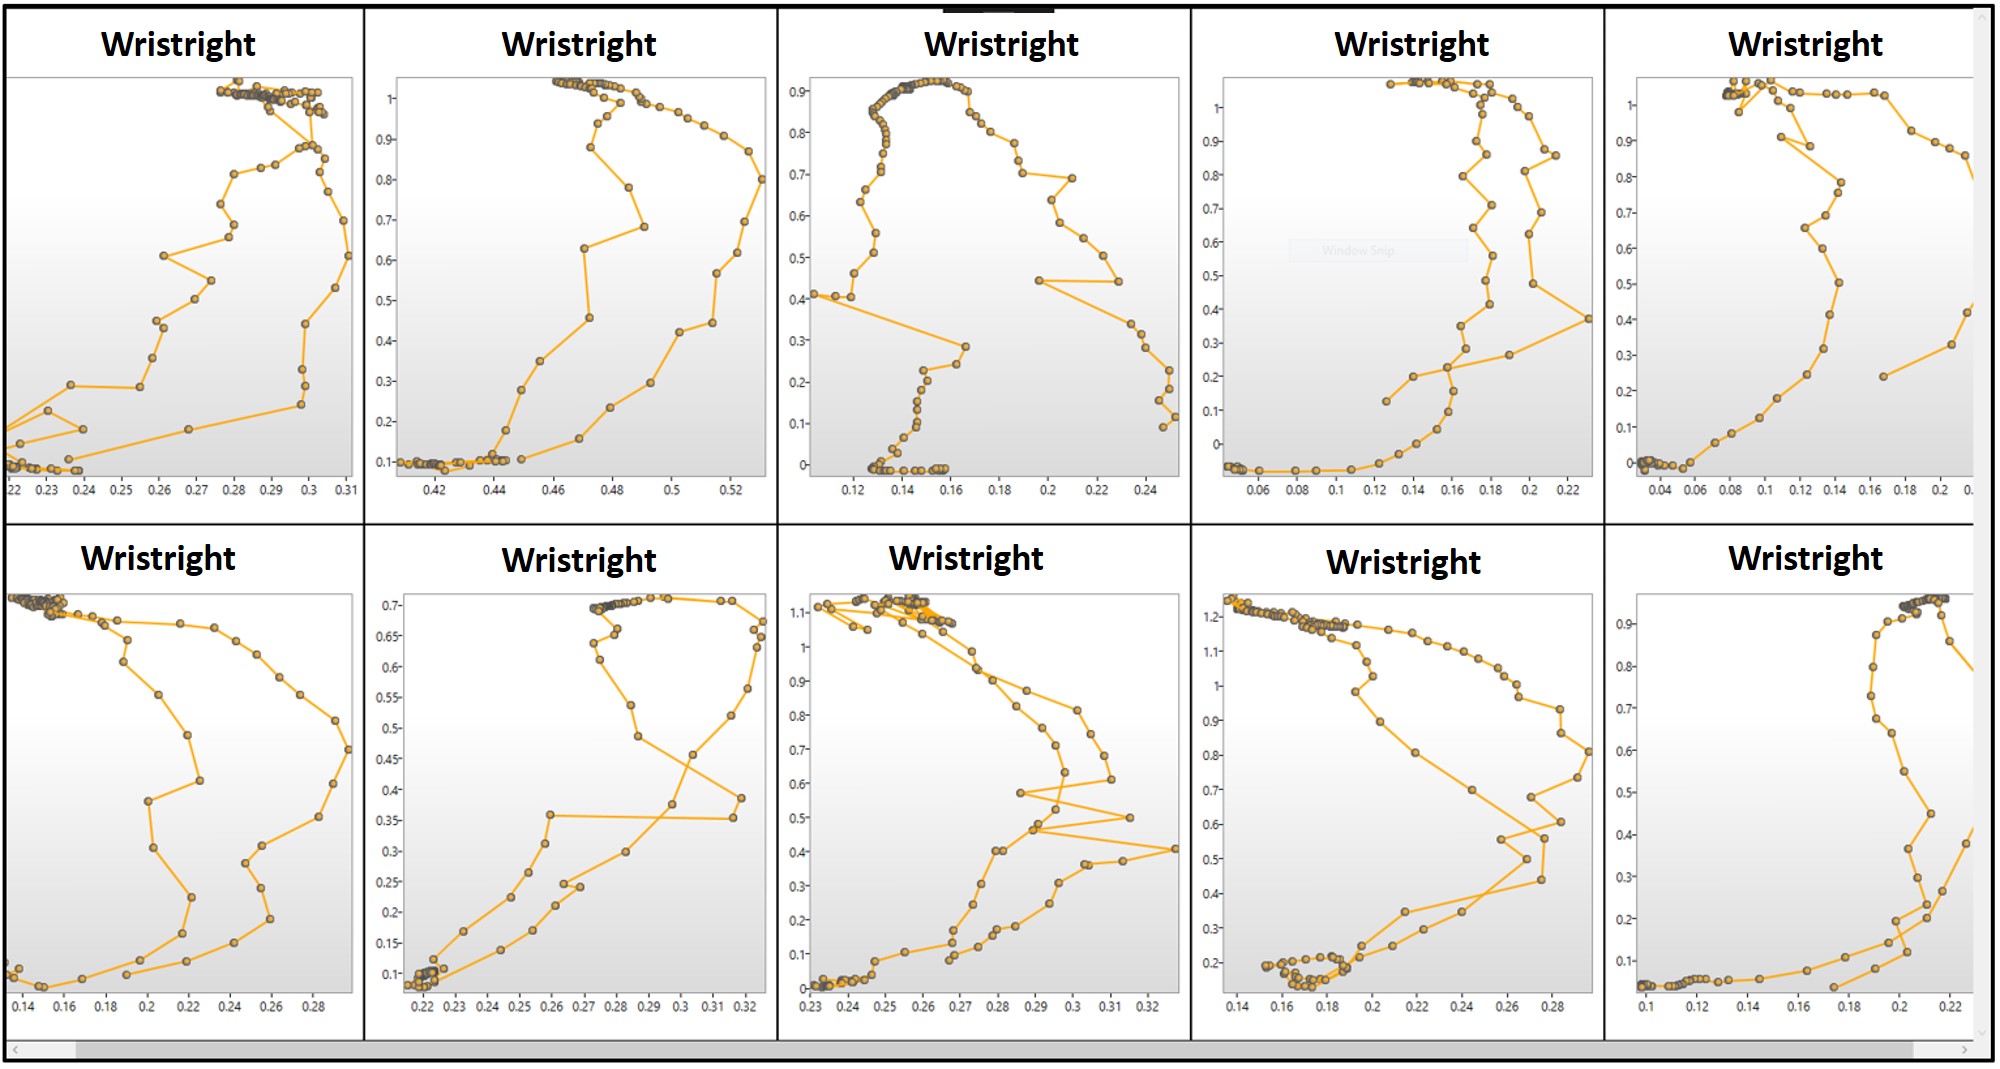
Figure 2b: Per Joint Visualization for the “Raise your Hand Motion” for all ten adults in the Kinder-Gator dataset when the right-hand wrist joint is selected. Each visualization is represented in 2D along the X-Y dimension.
In addition, an action comprises a set of poses. A pose shows the spatial arrangement of the joints (i.e., the human skeleton) at a given point in time. Therefore, I included an alternate type of visualization (averageFrame) that depicts the action in terms of the average pose over the entire duration of the action (Figure 3). The visualizations are shown in a new window after the “submit” button has been clicked.
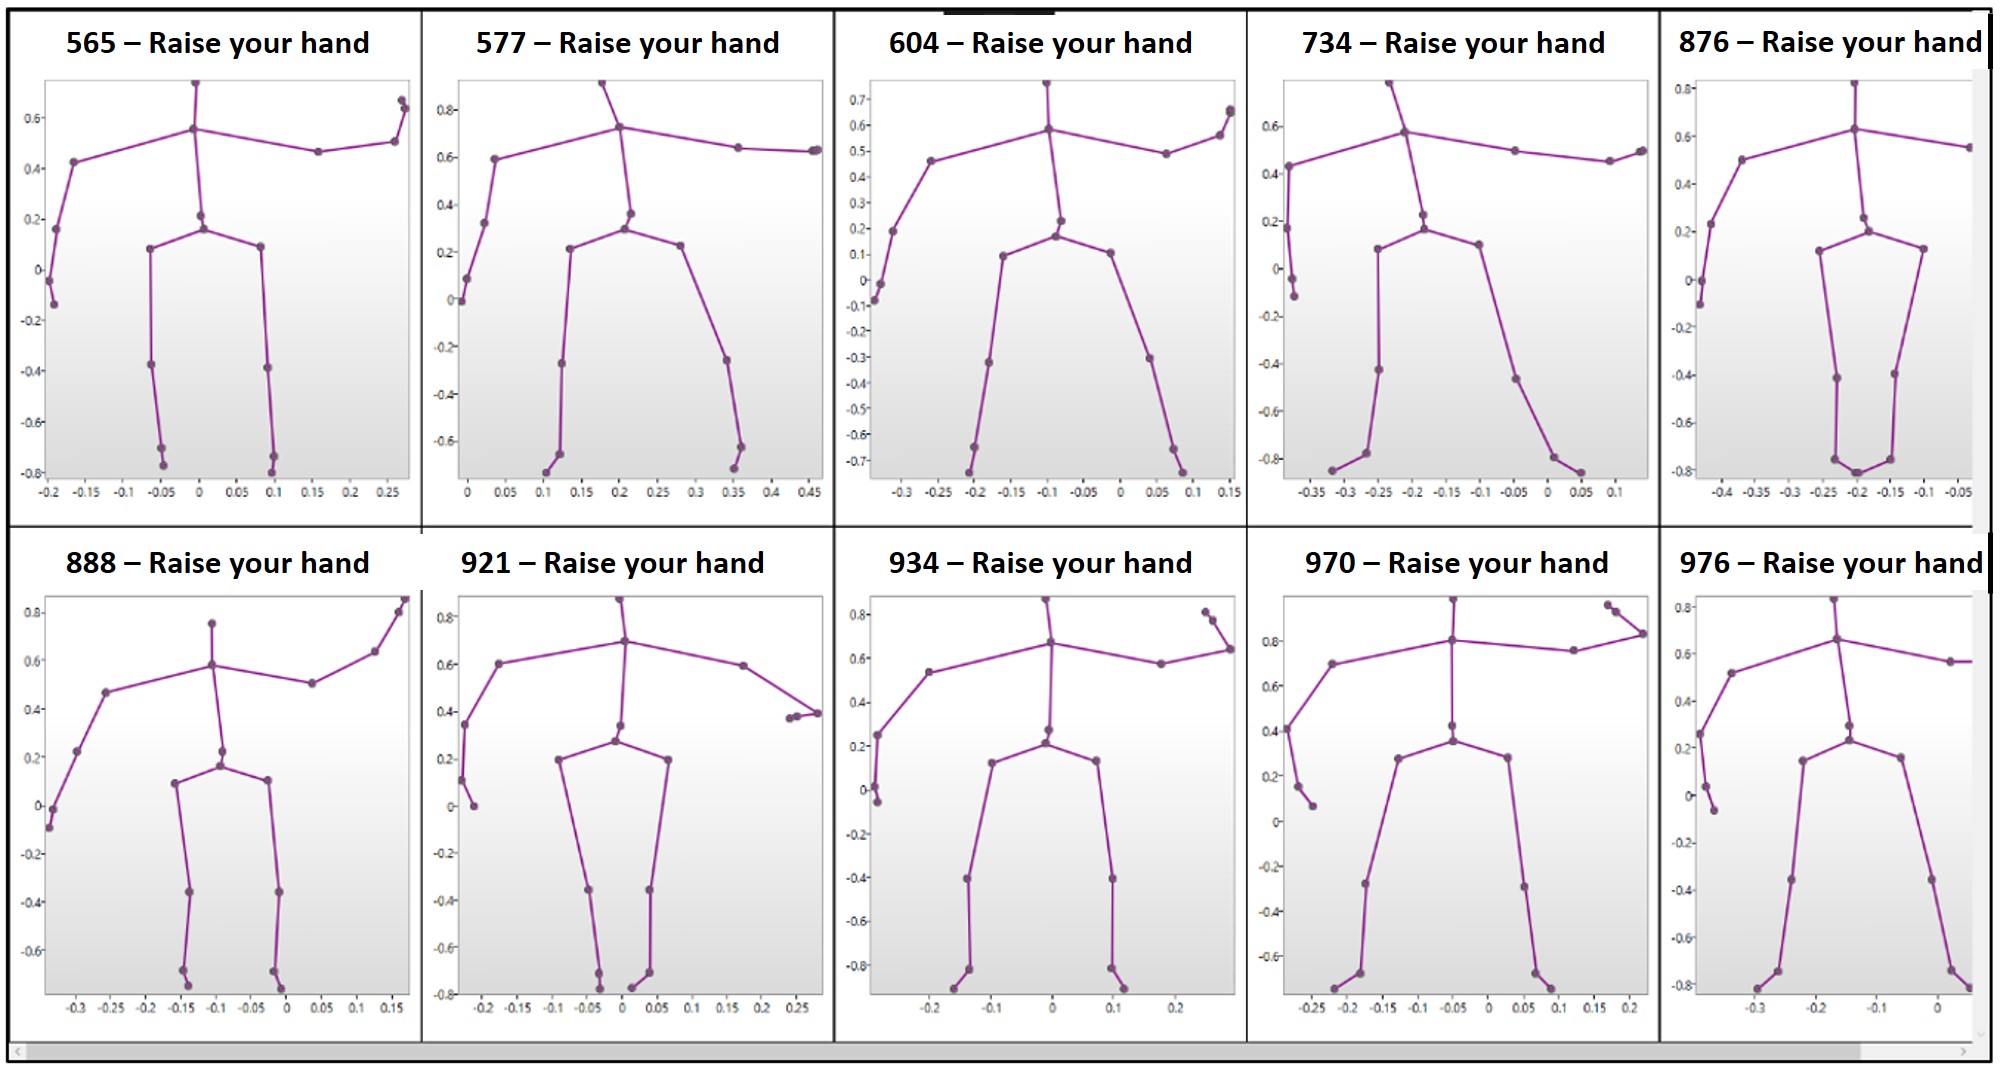
Figure 3: AverageFrame Visualization for the “Raise your Hand Motion” for all ten adults in the Kinder-Gator dataset. Each visualization is represented in 2D along the X-Y dimension.
Challenges
As a novice in the design of WPF applications, the first challenge I faced was setting up checkboxes to match each motion type in the dataset when designing the interface. My research found that I could create a control to hold a list (itemControl) when designing the interface using XAML. Then, once the user has selected the motion type, I created a list of checkbox controls in the C# code that connected to the XAML design and bound the checkboxes to the item control. Another challenge I faced was making sure that the visualizations shown accurately represent the preferences selected by the user from the interface window. This challenge resulted from the different options that users could select from (action, population, visualization, and joints), which meant that user preferences will span multiple permutations. To solve this challenge, I had to make sure that I use efficient data structures to keep track of users’ preferences throughout their interaction with the interface.
I am a fifth year Ph.D. student working in the INIT lab. By working on this toolkit, I have been able to use it to study the visualizations of different actions to gain a deeper understanding of the joint motion paths. Specifically, I have been able to understand how the motion paths of joints in an action differ based on joint movements, the action being performed, and the participant performing the action. For example, since the visualizations show the paths of a joint across all participants within a category (Figure 3), I can study these paths to identify what variations exist in how different users move that joint when performing similar actions. My next steps will focus on using this toolkit to visualize the joint paths of different motions and studying these paths to identify features that can characterize joint movements. Stay tuned for a future post in which we will release the toolkit for other researchers to use!
REFERENCES
- Aishat Aloba, Gianne Flores, Julia Woodward, Alex Shaw, Amanda Castonguay, Isabella Cuba, Yuzhu Dong, Eakta Jain, and Lisa Anthony. 2018. Kinder-Gator: The UF kinect database of child and adult motion. In EG 2018 – Short Papers., 13–16. https://doi.org/http://dx.doi.org/10.2312/egs.20181033.
- Getting started with WPF. https://docs.microsoft.com/en-us/visualstudio/designers/getting-started-with-wpf?view=vs-2019